Using the repoze.debug Response Logger
The repoze.debug response logger allows the developer to record
information about each request / response pair, and to analyze that
information to identify parts of the application which are performing badly.
This support comes as two separate components:
- The responselogger Middleware performs the actual logging of request / response data.
- The wsgirequestprofiler script console script generates various reports using those logs.
responselogger Middleware
The responslogger middleware creates two logs: the Verbose logger and the Trace logger.
The verbose log is human-readable.
The trace log is meant to be processed by the wsgirequestprofiler script (included).
Configuration via Python
To wire up the middleware in your application in imperative Python code:
from repoze.debug.responselogger import ResponseLoggingMiddleware
from logging import getLogger
middleware = ResponseLoggingMiddleware(
               app,
               max_bodylen=3072,
               keep=100,
               verbose_logger=getLogger('foo'),
               trace_logger=getLogger('bar'),
              )
The configuration options are as follows:
max_bodylenshould be the max size in bytes of the response body that should be logged.keepis the number of request entries to keep around in memory to service the Debug UI.verbose_loggeris a PEP 282 logger instance (any).trace_loggeris a PEP 282 logger instance (any).
Configuration via Paste
Wire the middleware into a pipeline in your Paste configuration, for example:
[filter:responselogger]
use = egg:repoze.debug#responselogger
verbose_log = %(here)s/response.log
trace_log = %(here)s/trace.log
# if max_bodylen is unset or is 0, it means do not limit body logging
# default is 3KB
max_bodylen = 3KB
# if max_logsize is unset or is 0, it means do not limit logsize; default is
# 100MB
max_logsize = 100MB
# if backup_count is 0, do not rotate the logfile.  Default is 10.
backup_count = 10
# "keep" is the the number of entries to keep around to show in the
# GUI. If keep is 0, no entries are kept (keeping entries around
# to show in the UI may be a security issue, as access to the GUI
# isn't authenticated)
keep = 100
...

[pipeline:main]
pipeline = egg:Paste#cgitb
           responselogger
           myapp
The middleware will log verbose response data to response.log and
will log trace data to trace.log.
Viewing Request / Response Data
Verbose logger
Once the middleware is in the pipeline, it will log human-readable information about requests and responses to the verbose logger. For example, the logged information for a request might be:
--- begin REQUEST for 5930704 at Mon Jun 30 13:37:51 2008 ---
URL: GET http://127.0.0.1:9971/favicon.ico
CGI Variables
  ACTUAL_SERVER_PROTOCOL: HTTP/1.1
  HTTP_ACCEPT: */*
  HTTP_HOST: 127.0.0.1:9971
  HTTP_USER_AGENT: ApacheBench/2.0.40-dev
  PATH_INFO: /favicon.ico
  REMOTE_ADDR: 127.0.0.1
  REMOTE_PORT: 56527
  REQUEST_METHOD: GET
  SERVER_NAME: vitaminf-2.local
  SERVER_PORT: 9971
  SERVER_PROTOCOL: HTTP/1.0
  SERVER_SOFTWARE: CherryPy/3.0.2 WSGI Server
WSGI Variables
  application: <paste.httpexceptions.HTTPExceptionHandler object at 0x17c4b10>
  wsgi process: Multithreaded
--- end REQUEST for 5930704 ---
Each request is tagged with a (random) identifier. A response is also
written to the verbose log, and can be matched up to the request that
generated it via the identifier. If max_bodylen is specified and
is nonzero, only the leading bytes of the body up to max_bodylen
are logged, otherwise the entire body is logged. Here’s an example of
a response in the log:
--- begin RESPONSE for 5930704 at Mon Jun 30 13:37:51 2008 ---
URL: GET http://127.0.0.1:9971/favicon.ico
Status: 200 OK
Response Headers
  Accept-Ranges: bytes
  Content-Length: 112
  Content-Type: application/octet-stream
  Last-Modified: Thu, 29 May 2008 23:47:57 GMT
Body:
^@^@^A^@^F^@^P^P^@^@^A^@ ^@h^D^@^@f^@^@^@^P^P^@^@^A^@^H^@h^E^@^@<CE>^D^@^@
^@^@^A^@ ^@<A8>^P^@^@6
Bodylen: 112
--- end RESPONSE for 5930704 (0.03 seconds) ---
Debug UI
If your application pipline includes the repoze.debug responselogger
middleware, you can vist the path /__repoze.debug/static/debugui.html in
your browser to see a paned debug interface:
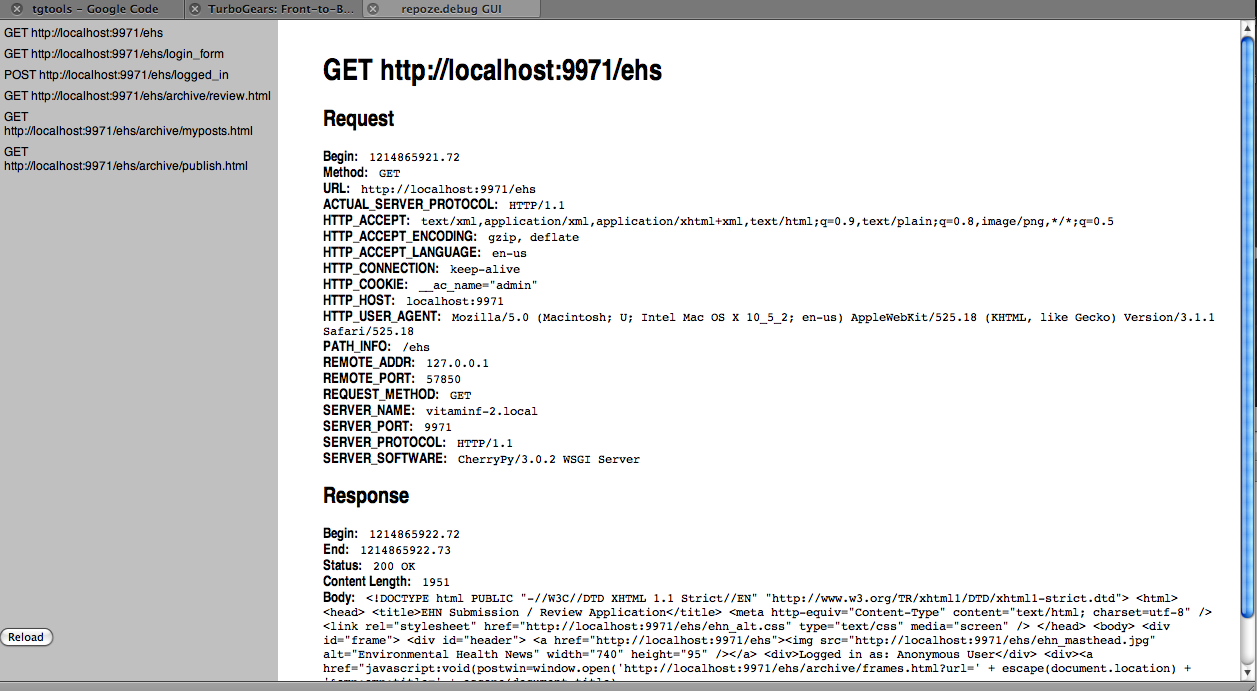
This page shows recent requests and responses, up to as many
request/response pairs are kept around as specified by the keep
value in the middleware configuration.
Analyzing the Log Data
Trace logger
The trace logger logs detailed debugging information about WSGI requests and responses. This logging can be turned on while the server is in production. It can then be postprocessed to help locate troublesome application code.
The format of a log message is:
{code} {pid} {request id} {time} {data}
Where:
{code} is B for begin, A for received output from the application,
E for finished sending output to the client.  A special code
exists, U, that is not really tied to any particular request.  It
is written to the log upon the first request after the server
is started.

{request id} is a unique request id.

{time} is the local time as seconds past the epoch.

{data} is the HTTP method and the URL for B, the HTTP status code
and the value of the content-length header for A, the actual
content length for E, and nothing for U.
For example:
U 91978 5930704 1214847471.97
B 91978 5930704 1214847471.97 GET http://127.0.0.1:9971/favicon.ico
B 91978 17963168 1214847471.97 GET http://127.0.0.1:9971/favicon.ico
A 91978 17963168 1214847471.99 200 112
A 91978 5930704 1214847471.99 200 112
E 91978 17963168 1214847471.99 112
E 91978 5930704 1214847471.99 112
B 91978 18022448 1214847472.0 GET http://127.0.0.1:9971/favicon.ico
A 91978 18022448 1214847472.01 200 112
B 91978 48634016 1214847472.01 GET http://127.0.0.1:9971/favicon.ico
E 91978 18022448 1214847472.01 112
B 91978 7805232 1214847472.01 GET http://127.0.0.1:9971/favicon.ico
A 91978 48634016 1214847472.01 200 112
E 91978 48634016 1214847472.01 112
A 91978 7805232 1214847472.02 200 112
E 91978 7805232 1214847472.02 112
This information is meant to be parsed with the included
wsgirequestprofiler console script to help in debugging hangs or
requests that take “too long”. Run the wsgirequestprofiler script
with the –help flag for more information.
wsgirequestprofiler script
Usage:
$ bin/wsgirequestprofiler filename1 [filename2 ...]
       [--cumulative | --detailed | [--timed --resolution=seconds]]
       [--sort=spec]
       [--top=n]
       [--verbose]
       [--today | [--start=date] [--end=date] | --daysago=n ]
       [--writestats=filename | --readstats=filename]
       [--urlfocus=url]
       [--urlfocustime=seconds]
       [--help]
Provides a profile of one or more repoze.debug “trace” log files.
Note that this script is a port of the Zope2 requestprofiler
script (written originally in 2001!)
Reports are of four types: cumulative, detailed, timed, or
urlfocus. By default, the script produces a cumulative report.
Data is taken from one or more Trace logger files, or from a
preprocessed statistics file.
For cumulative reports, each line in the profile indicates information
about a URL collected via a detailed request log.
For detailed reports, each line in the profile indicates information about
a single request.
For timed reports, each line in the profile indicates information about
the number of requests and the number of requests/second for a period of time.
For urlfocus reports, the report contains ad-hoc information about
requests which precede or follow requests for specified URL.
Each filename is a path to a trace log that contains detailed
request data. Multiple input files can be analyzed at the same time
by providing the path to each file. Analyzing multiple trace log
files at once is useful if you have more than one machine running your
application and you’d like to get an overview of all logs on those
machines.
If you wish to make multiple analysis runs against the same input
data, you may want to use the --writestats option. The --writestats
option creates a file which holds preprocessed data representing the
specfified input files. Running subsequent reports (for example with
different sort specs) will be much faster using the --readstats option
with that saved file, rather than re-parsing the log files.
If a sort value is specified, sort the profile info by the spec.
The sort order is descending unless indicated. The default cumulative
sort spec is total. The default detailed sort spec is start.
cumulative reports understand following sort specs:
hits- the number of hits against the method
hangs- the number of unfinished requests to the method
max- the maximum time in secs taken by a request to this method
min- the minimum time in secs taken by a request to this method
mean- the mean time in secs taken by a request to this method
median- the median time in secs taken by a request to this method
total- the total time in secs across all requests to this method
url- the URL/method name (ascending)
detailed (non-cumulative) reports understand the following sort specs:
start- the start time of the request to repoze.debug (ascending)
win- the num of secs repoze.debug spent waiting for input
wout- the secs repoze.debug spent waiting for output from app
wend- the secs repoze.debug spent sending data to server
total- the secs taken for the request from begin to end
endstage- the last successfully completed request stage (B, I, A, E)
osize- the size in bytes of output provided by repoze.debug
httpcode- the HTTP response code provided by the app (ascending)
active- total num of requests pending at the end of this request
url- the URL (ascending)
timed and urlfocus reports do not allow any sort specs.
The top option restricts the report to the top n entries
in the profile (as per the sort). By default, each report shows all data in
the profile.
The verbose argument prevents the report from trimming URLs to fit
into 80 columns.
The today argument limit results to hits received today.
The daysago argument limits results to hits received since n days ago.
The resolution argument is used only for timed reports: it specifies
the number of seconds between consecutive lines in the report. The default
value is 60 seconds.
The urlfocustime argument is used only for urlfocus reports: it
specifies the number of seconds to target before and after the URL
provided in urlfocus mode. The default value is 10 seconds.
The start argument limits results to hits received after the specified
date/time, given in the form DD/MM/YYYY HH:MM:SS (local time)
The end argument limits results to hits received before the specified
date/time, given in the form ‘DD/MM/YYYY HH:MM:SS’ (local time),
The start and end arguments are not honored when request statistics
are obtained via the --readstats argument.
wsgirequestprofiler Examples
Show cumulative report statistics for information in the file ‘debug.log’, by default sorted by ‘total’:
$ bin/wsgirequestprofiler debug.log
Show detailed report statistics sorted by ‘start’ (by default):
$ bin/wsgirequestprofiler debug.log --detailed
Show detailed report statistics for both logs sorted by ‘start’ (by default):
$ bin/wsgirequestprofiler debug.log debug2.log --detailed
Show cumulative report statistics sorted by mean for entries in the log which happened today; do not trim the URL in the resulting report:
$ bin/wsgirequestprofiler debug.log \
  --cumulative --sort=mean --today --verbose
Show cumulative report statistics, sorted by mean, for entries in the log which happened three days ago; do not trim the URL in the resulting report:
$ bin/wsgirequestprofiler debug.log \
  --cumulative --sort=mean --daysago=3 --verbose
Show a urlfocus report which displays statistics about requests
surrounding the invocation of /manage_main. Focus on the time periods
60 seconds before and after each invocation of the /manage_main URL:
$ bin/wsgirequestprofiler debug.log \
  --urlfocus='/manage_main' --urlfocustime=60
Show detailed report statistics for entries in debug.log which
begin after 6am local time on May 10, 2001 and which end before
11pm local time on May 11, 2001:
$ bin/wsgirequestprofiler debug.log \
  --detailed --start='2001/05/10 06:00:00' --end='2001/05/11 23:00:00'
Show timed report statistics for entries in the log for one day, using a resolution of 5 minutes:
$ bin/wsgirequestprofiler debug.log \
  --timed --resolution=300 --start='2001/05/10 06:00:00'
  --end='2001/05/11 23:00:00'
Show cumulative report of the the top 100 methods sorted by maximum
elapsed time:
$ bin/wsgirequestprofiler debug.log --top=100 --sort=max
Write a stats file for debug.log and debug2.log into requests.stat and
show the default report:
$ bin/wsgirequestprofiler debug.log debug2.log --writestats='requests.stat'
Read from the requests.stat stats file (instead of actual log files)
and show the detailed report against this data:
$ bin/wsgirequestprofiler --readstats='requests.stat' --detailed
Sample wsgirequestprofiler output
Sample output from wsgirequestprofiler trace.log:
Hangs  Hits    Total   Max   Min   Med  Mean URL
    0   848    88.58  2.14  0.02  0.10  0.10 http://127.0.0.1:9971/ehs
    0   737    73.24  1.45  0.02  0.10  0.10 http://127.0.0.1:9971/ehs/login_f
    0     2    13.83 12.41  1.42  6.92  6.92 http://localhost:9971/ehs/archive
    0     1     0.55  0.55  0.55  0.55  0.55 http://localhost:9971/ehs/archive
    0     1     0.49  0.49  0.49  0.49  0.49 http://localhost:9971/ehs/archive
    0     1     0.29  0.29  0.29  0.29  0.29 http://localhost:9971/ehs
    0     1     0.19  0.19  0.19  0.19  0.19 http://localhost:9971/ehs/archive
    0     1     0.13  0.13  0.13  0.13  0.13 http://localhost:9971/ehs/archive
    0     1     0.06  0.06  0.06  0.06  0.06 http://localhost:9971/ehs/archive
    0     1     0.06  0.06  0.06  0.06  0.06 http://localhost:9971/ehs/archive
    0     1     0.02  0.02  0.02  0.02  0.02 http://localhost:9971/empty.css
    0     1     0.01  0.01  0.01  0.01  0.01 http://localhost:9971/ehs/archive
    0     1     0.01  0.01  0.01  0.01  0.01 http://localhost:9971/ehs/ehn_alt